Explore our data insights
Dive into real-world stories where data makes the difference.
Discover how we’ve used advanced analytics and smart visualization to uncover trends, improve decision-making, and generate value. From analyzing urban crime patterns to predicting population changes, our insights are driven by purpose and precision.
Our Projects

Analysis crime patterns in LA

Visualizing Criminality across LA

Supporting Crime Reduction Efforts with Data
Visualizing Criminality across LA
Through interactive charts and data-driven dashboards, we highlight key insights such as the most dangerous areas, the prevalence of specific crime types, and the impact of weekdays and seasons on crime rates.
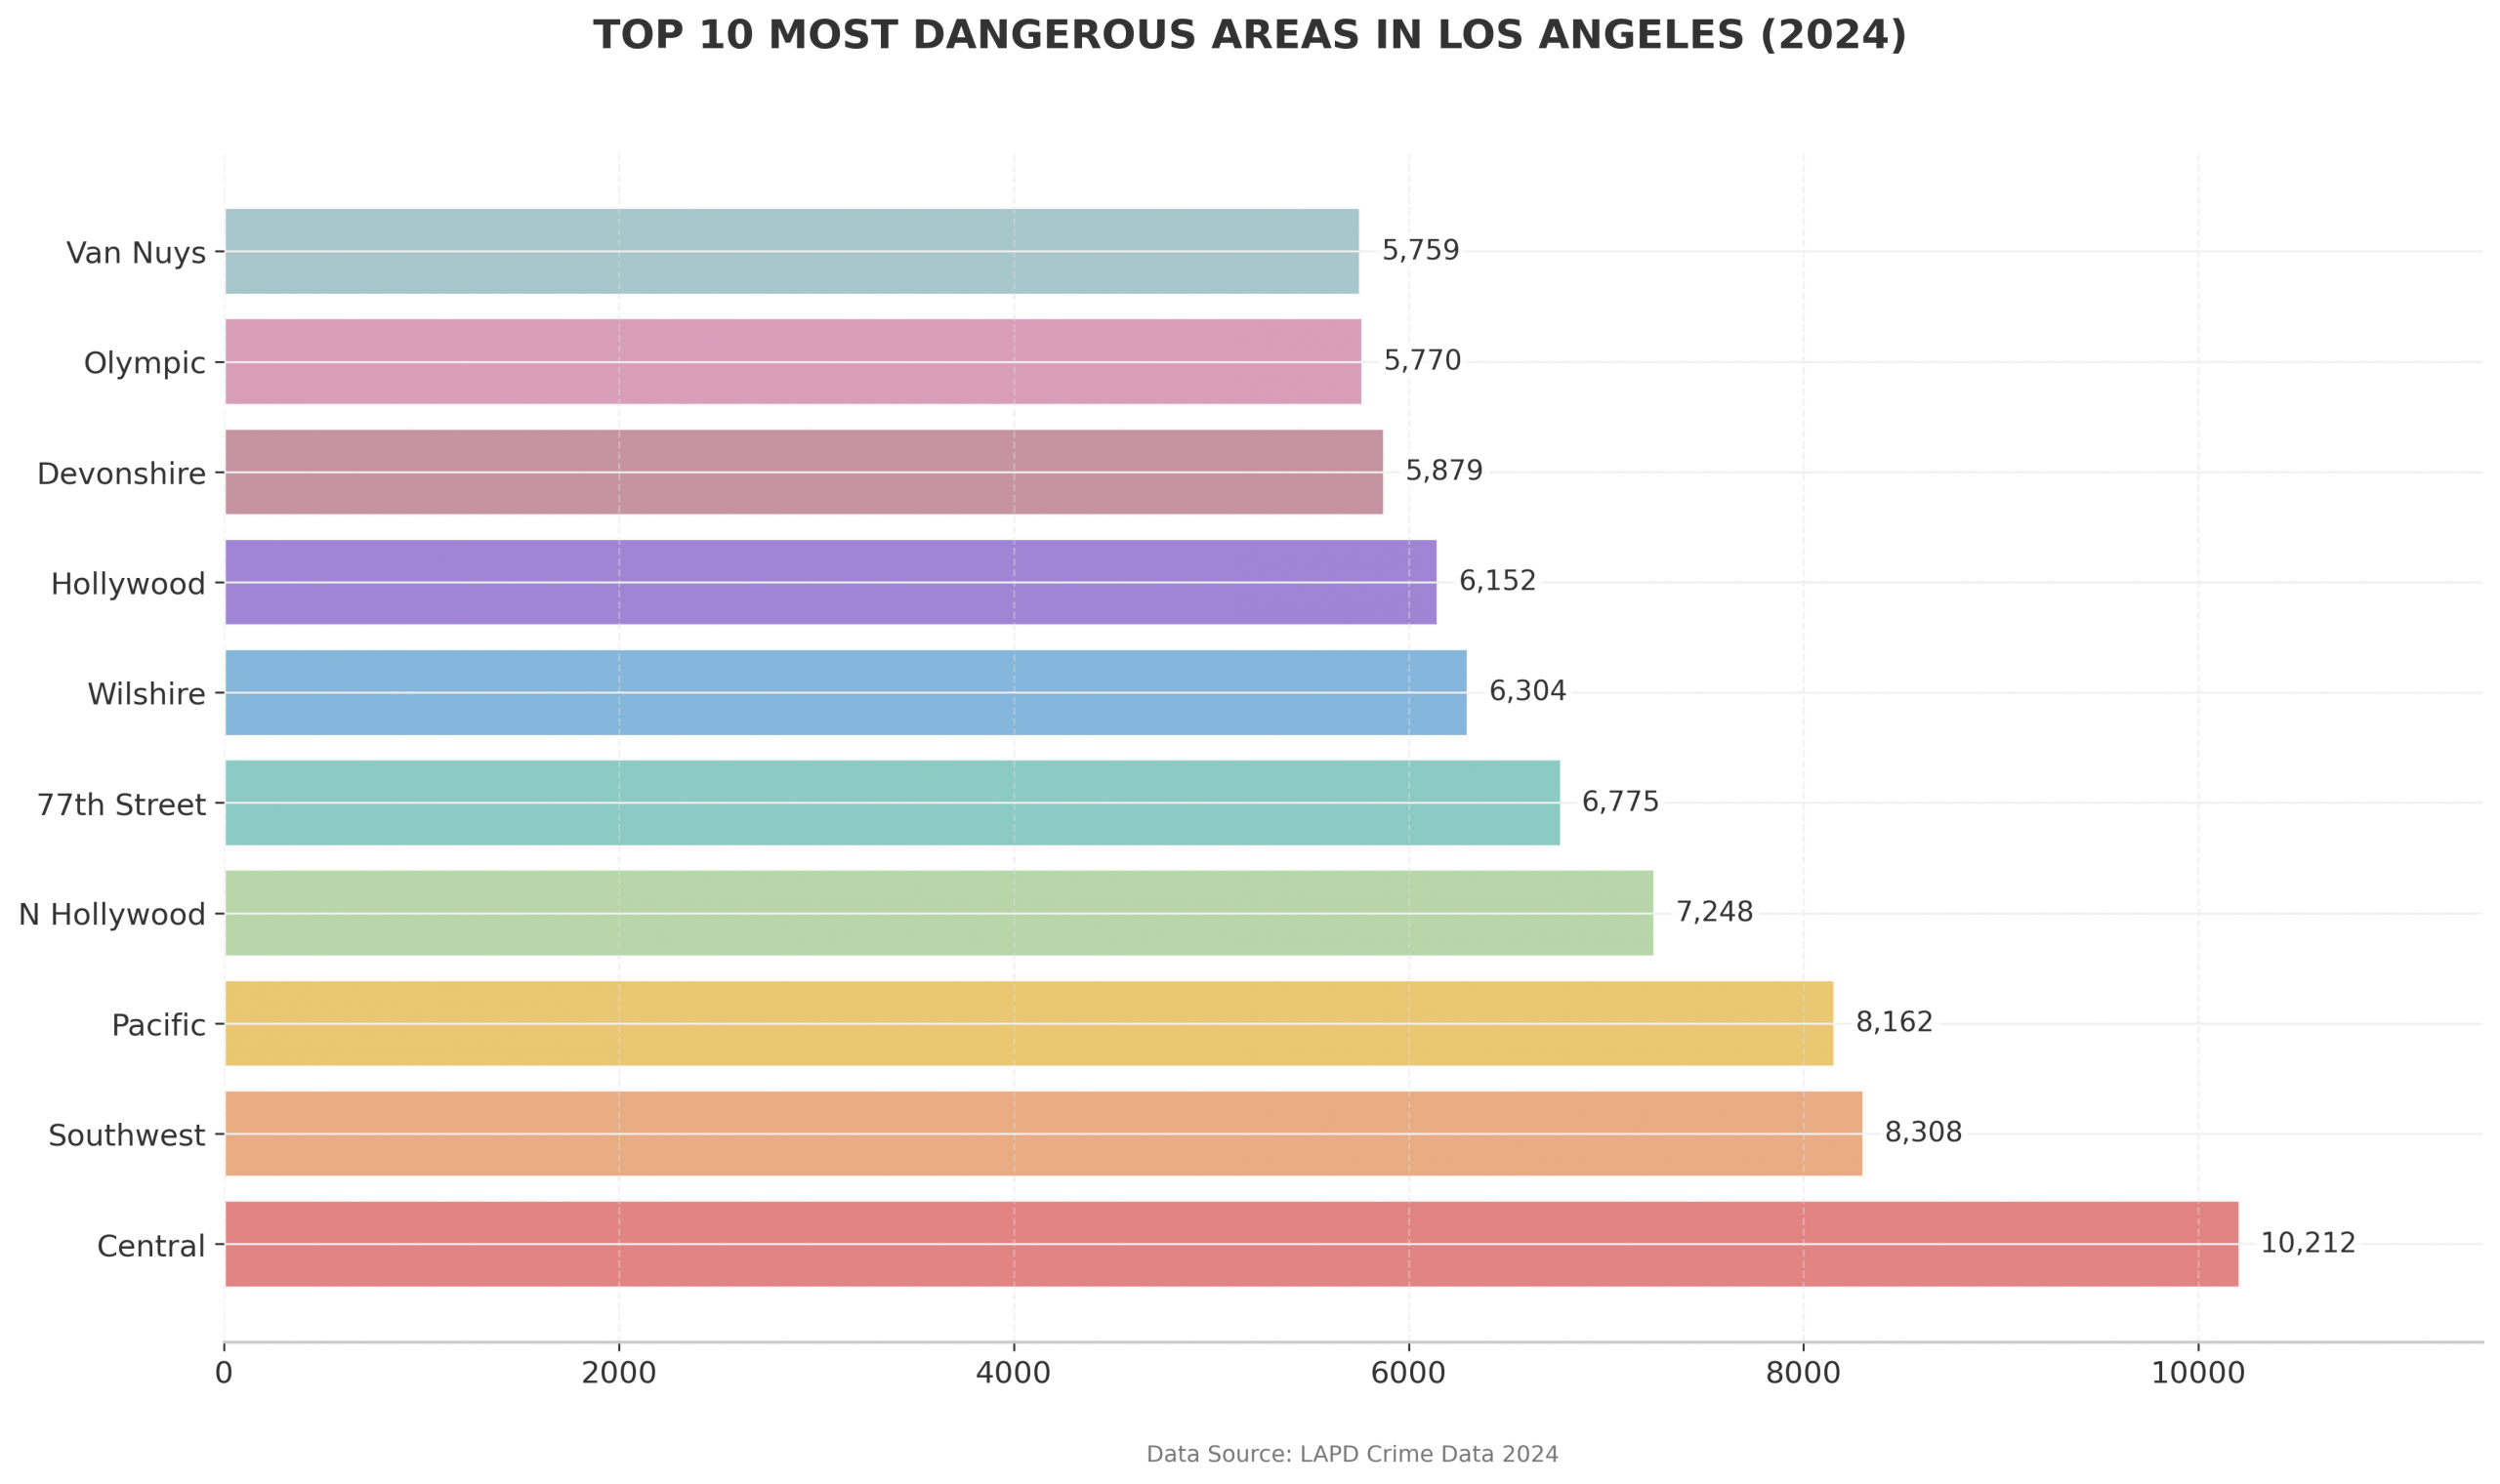
📍 Most Affected Areas: Where Crime Hits Hardest
Which parts of LA experience the highest crime rates?
This section presents a clear comparison of the city’s most affected neighborhoods using ranked bar plots based on incident reports. By identifying the top hotspots, we bring attention to areas with recurring safety concerns and highlight where intervention could have the greatest impact.
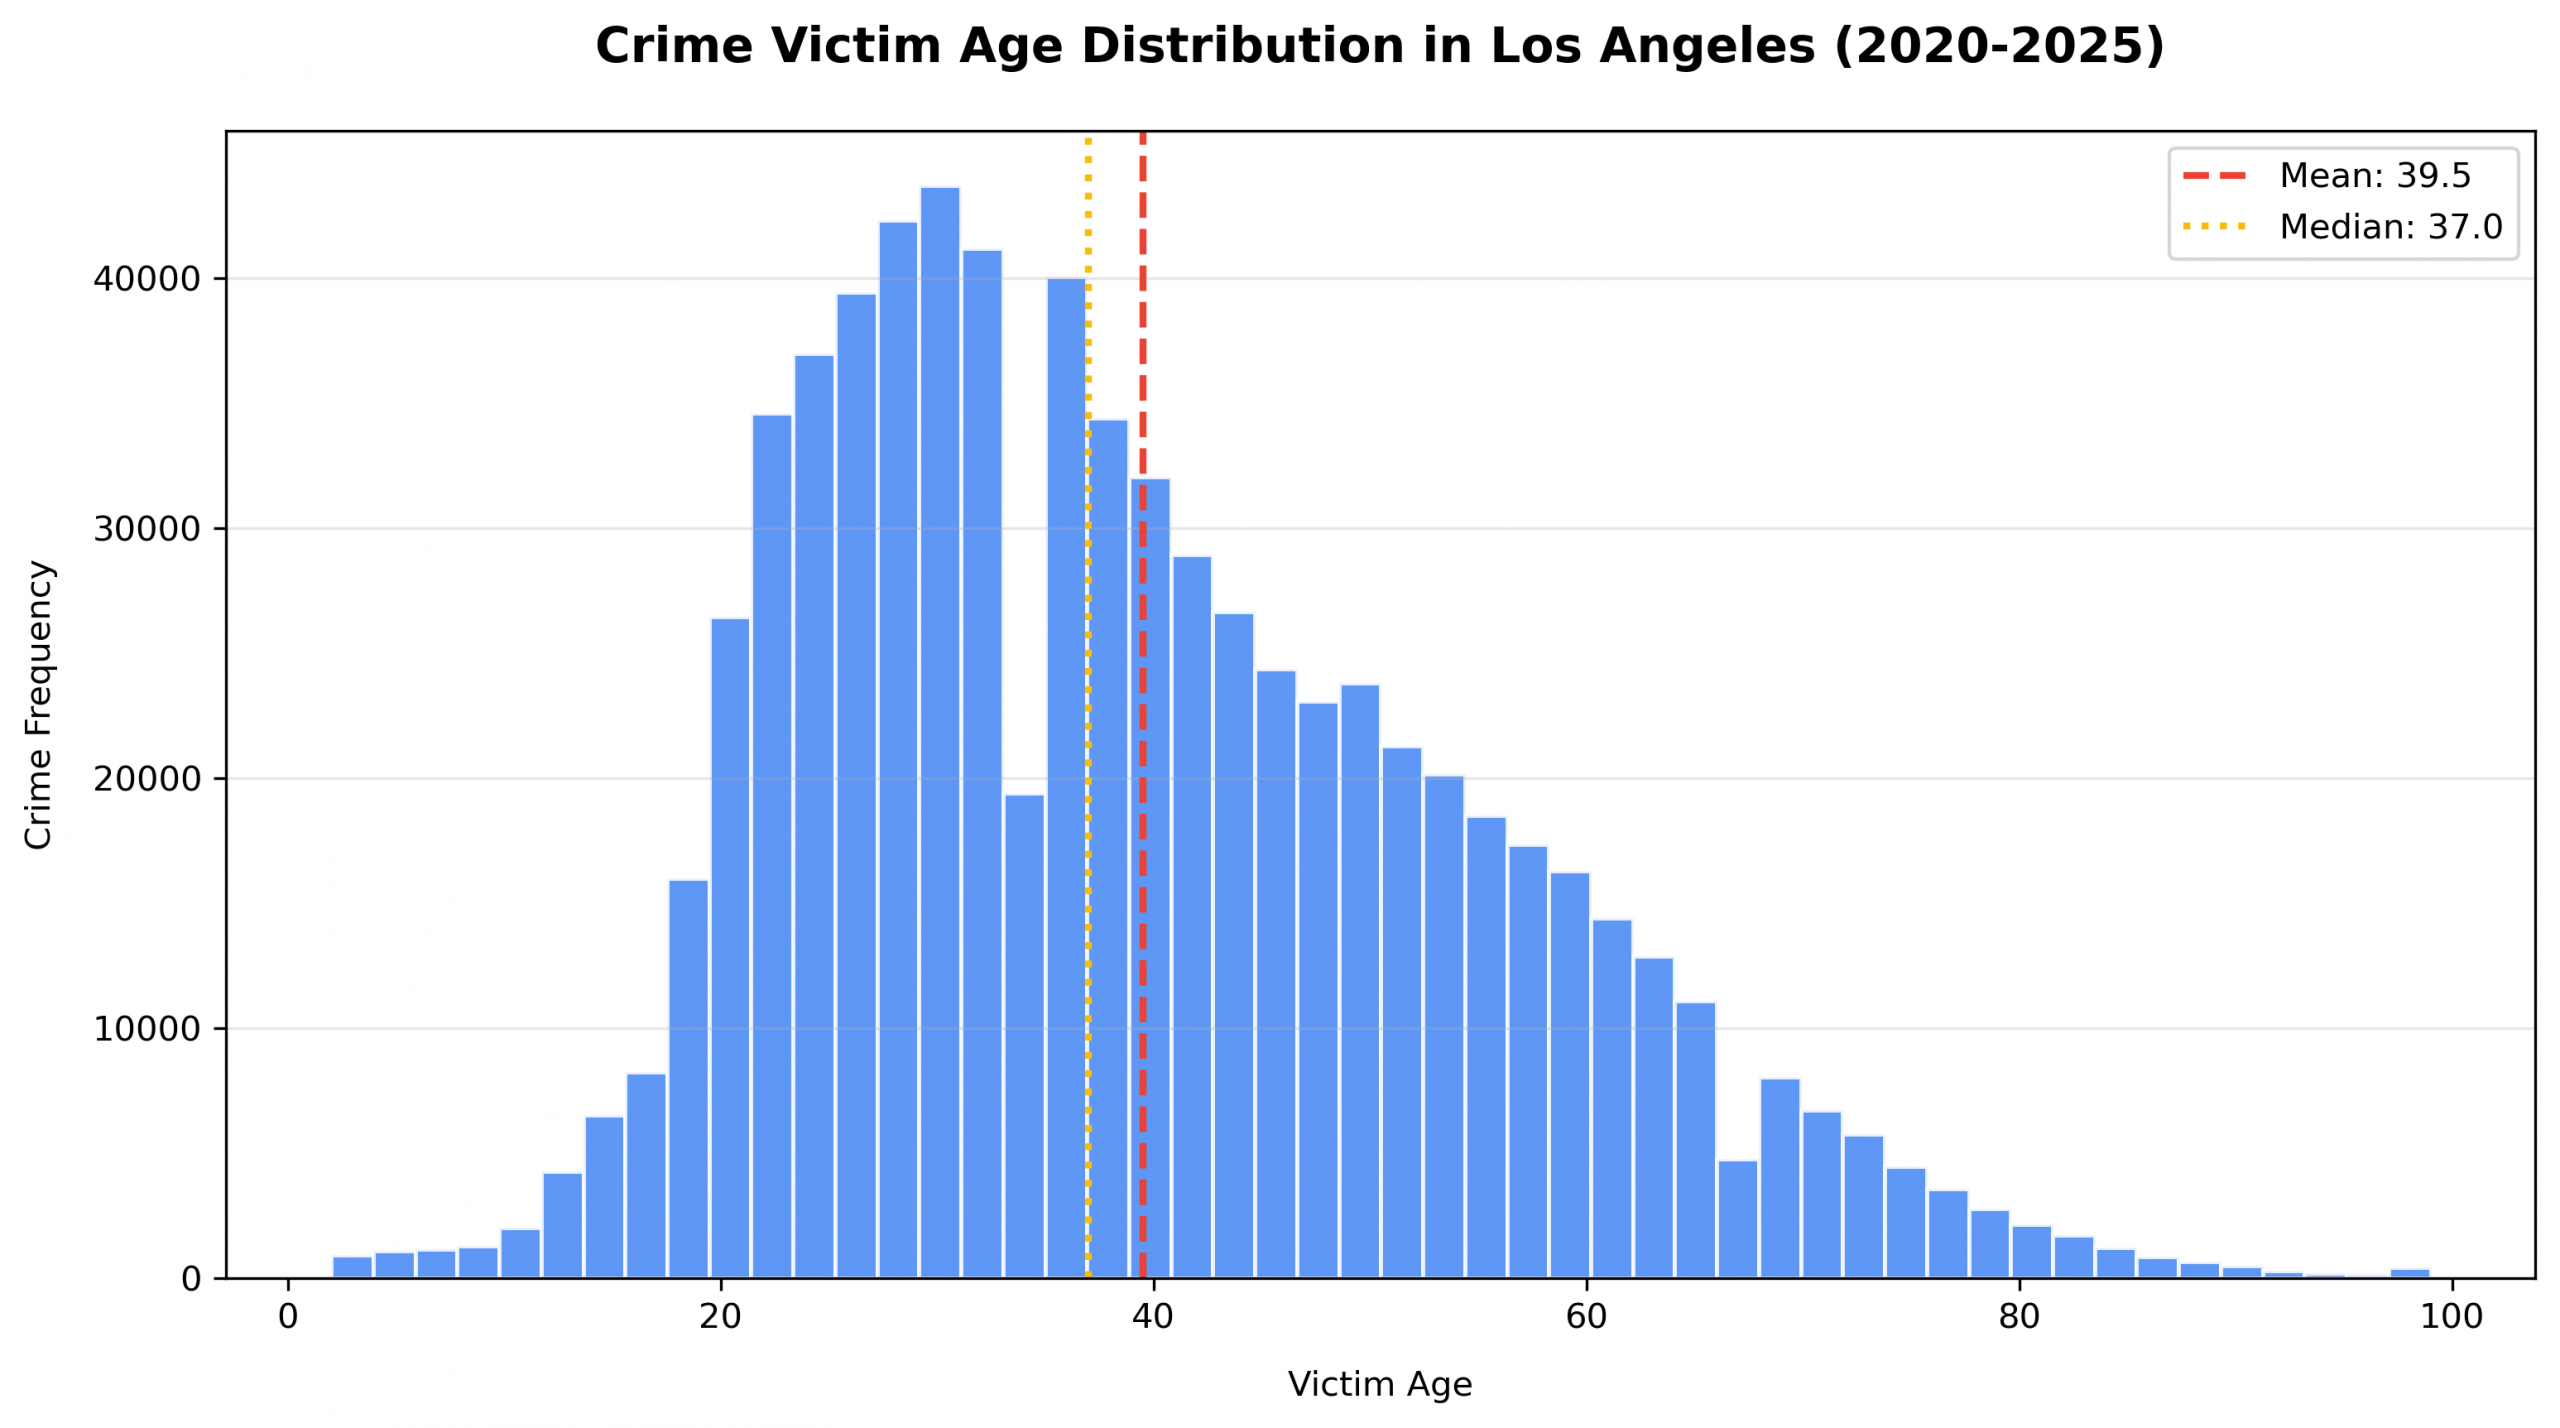
Victim Age Distribution in LA Crime
Understand how age correlates with criminal victimization across Los Angeles.
This section breaks down the age profiles of victims to reveal which age groups are most frequently affected by different types of crime. By identifying vulnerable populations, we can better inform prevention strategies and targeted interventions.
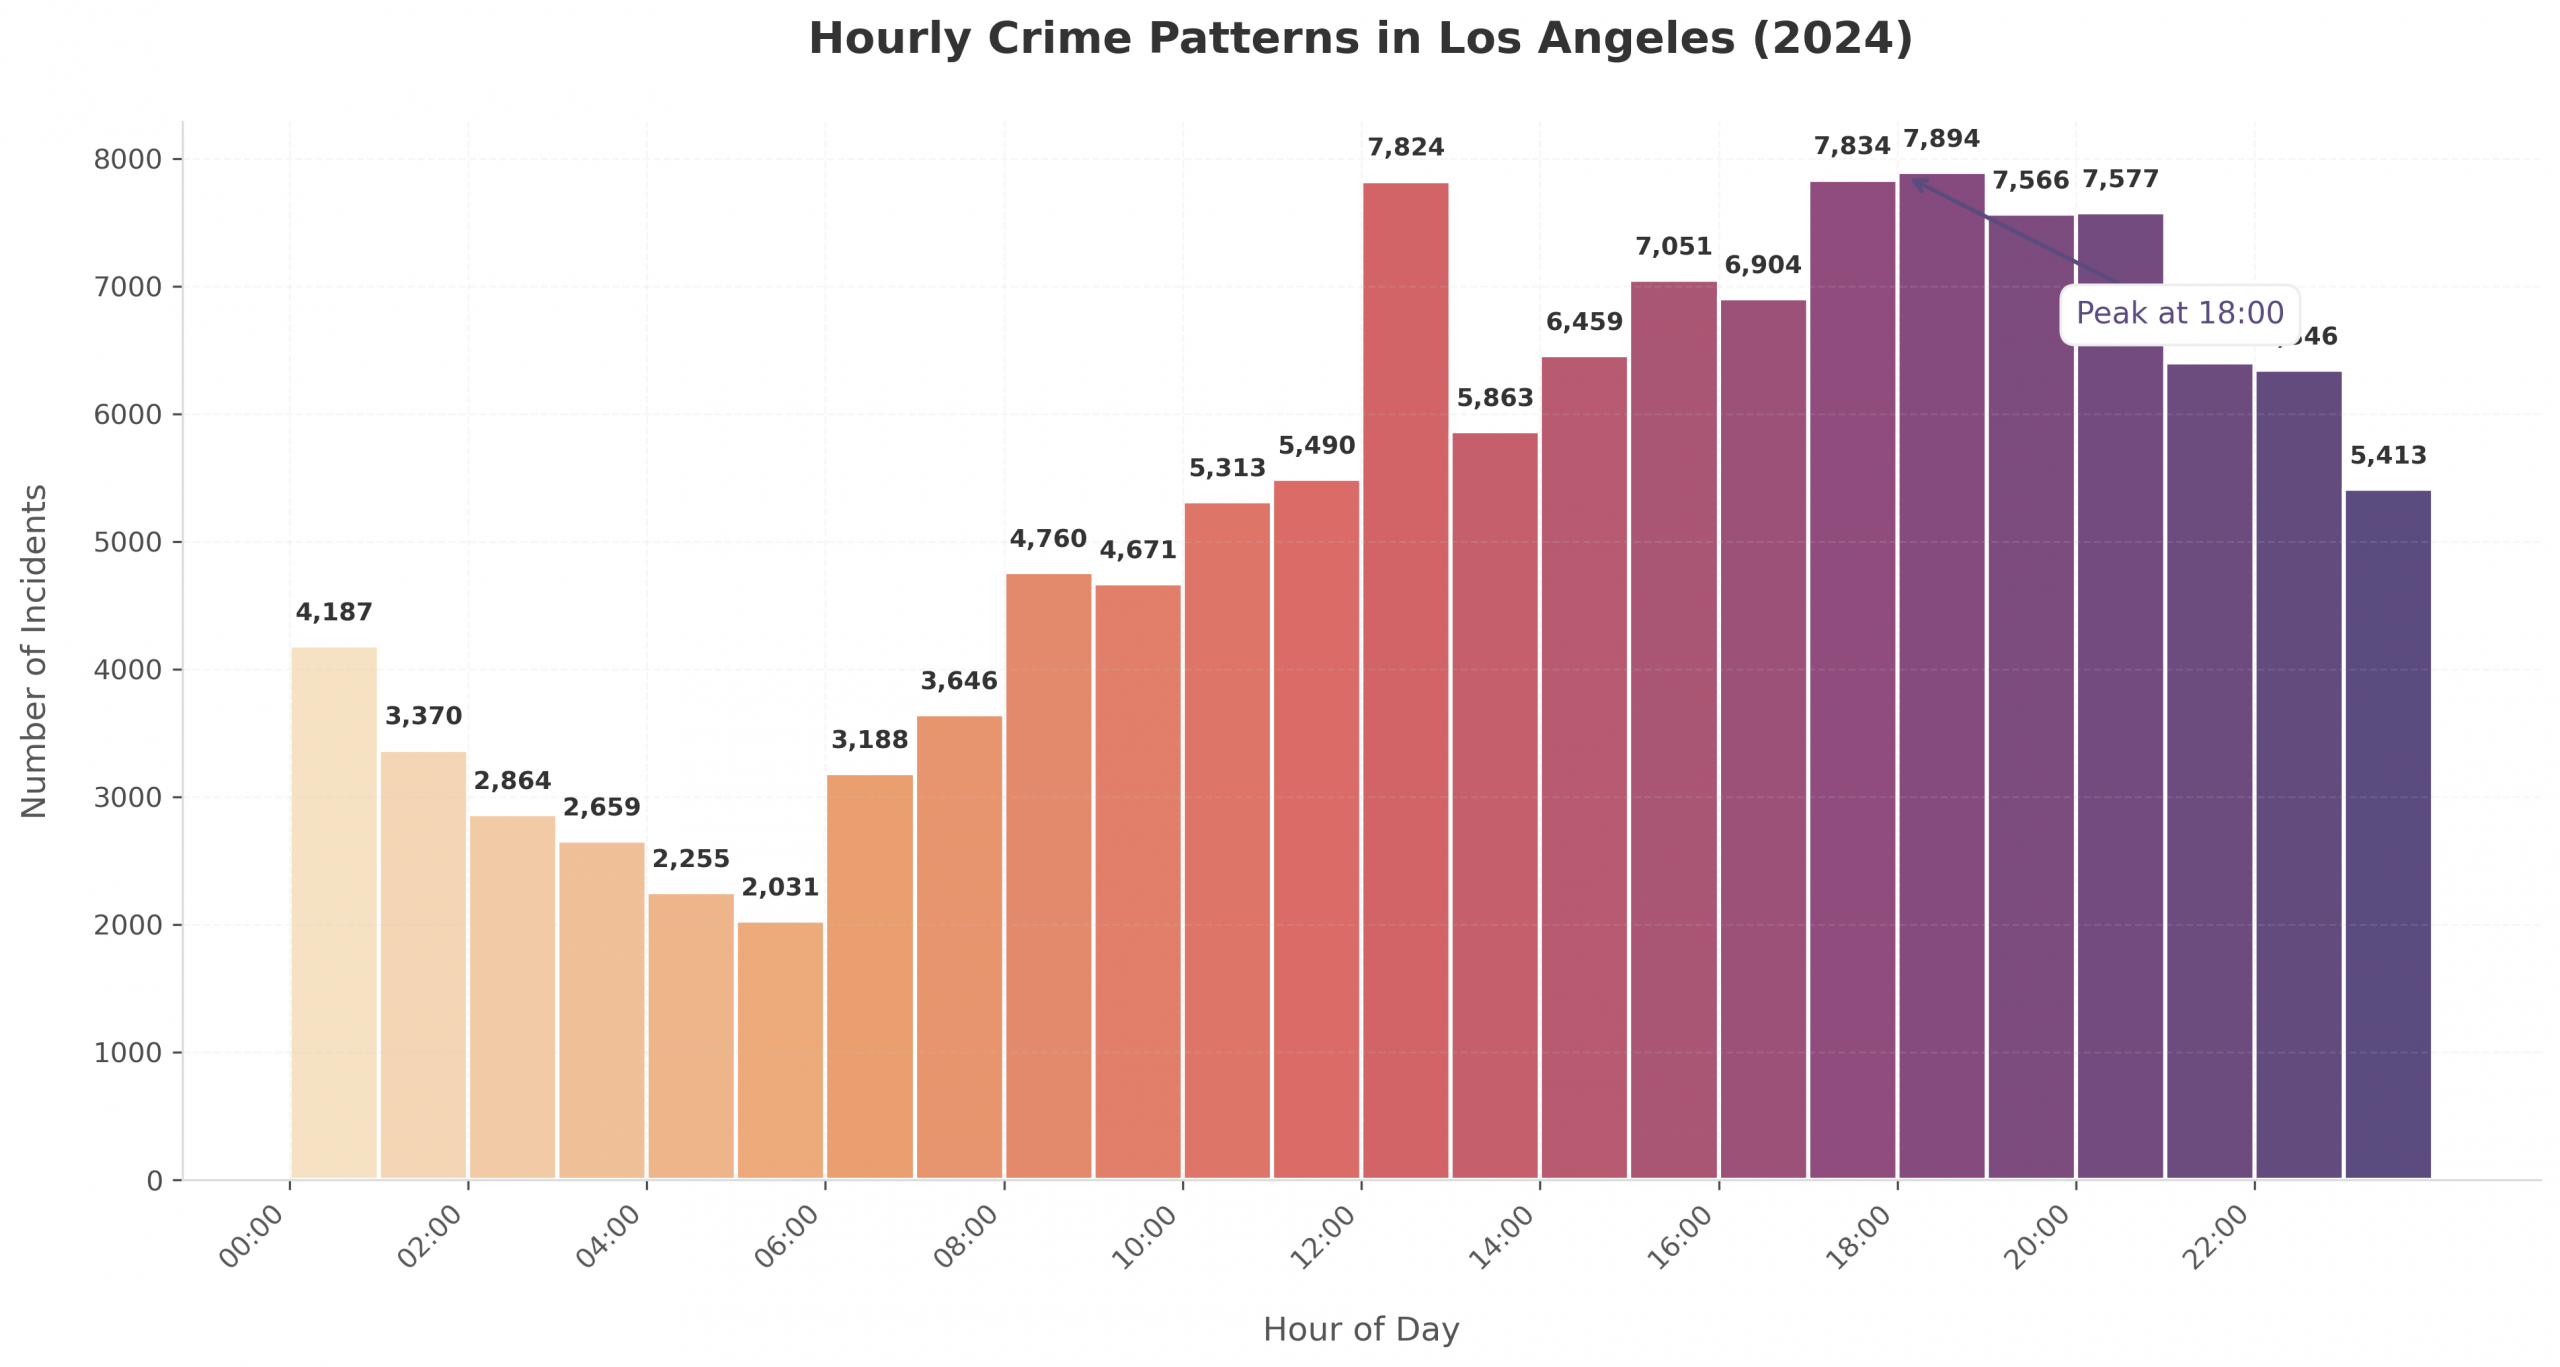
Hourly Crime Trends
Analyze which hours of the day see the highest and lowest crime rates in LA.
Subscribe to our Newsletter
Never miss an update from Safe LA!